Web & App DevelopmentI make breathtaking apps
Financial Planner
Financial Planner

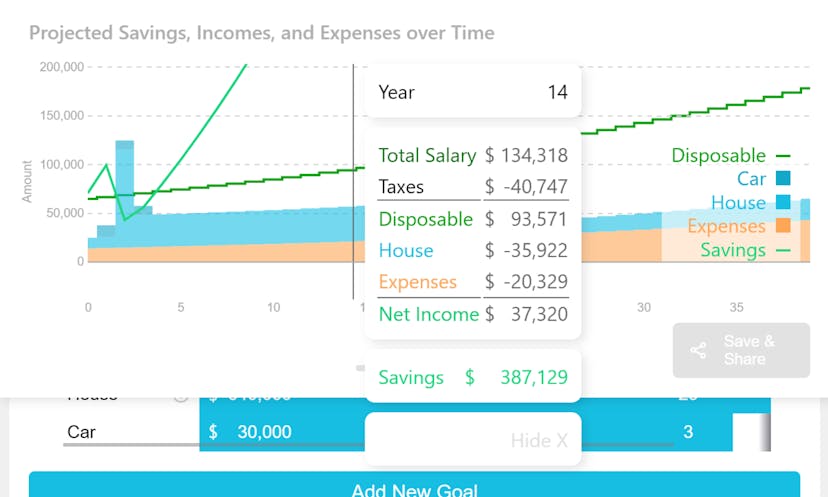
Empowers financial freedom by projecting big-ticket decisions, incomes, and expenses with taxes automatically included.

Recommender System UI

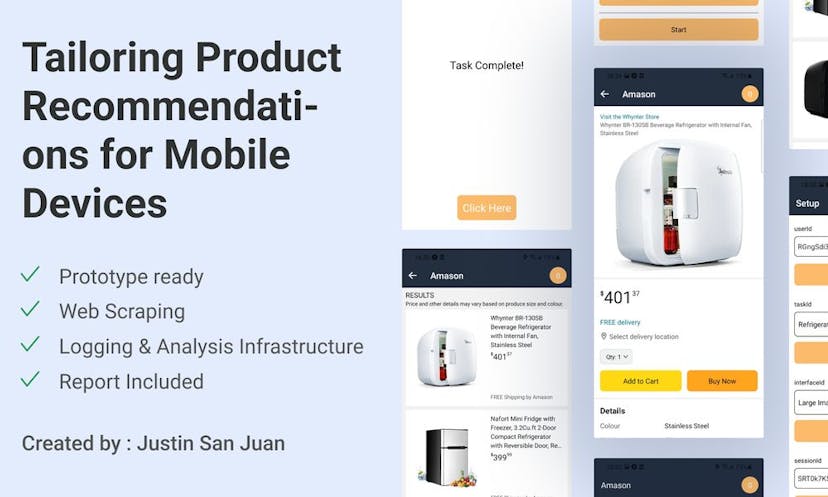
Tailoring Product Recommendations for Mobile Devices. A research project in user interface design. Includes a React Native prototype app, web scraping code, logging & analysis AWS infrastructure, and report.

Graph Algorithms Visualization

Graph algorithms implemented and visualized in D3.

Readily Chrome Extension

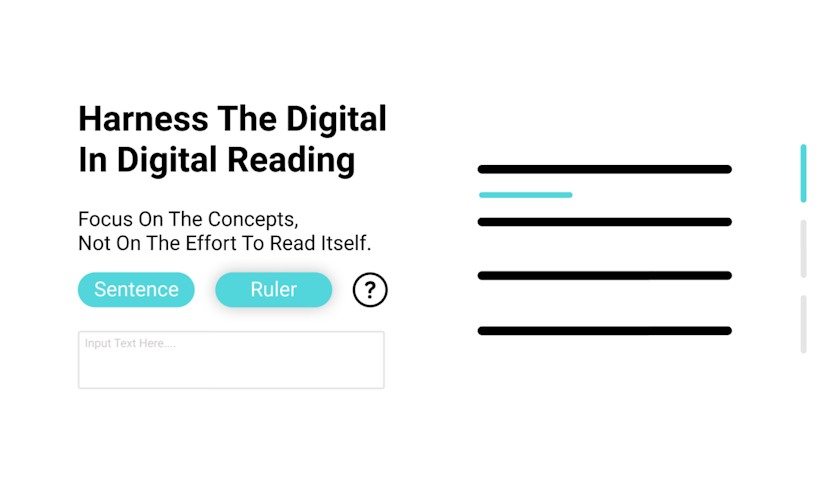
Reading Made Easier. Made for enhancing focus and empowering readership among people.

Abode Home Maintenance

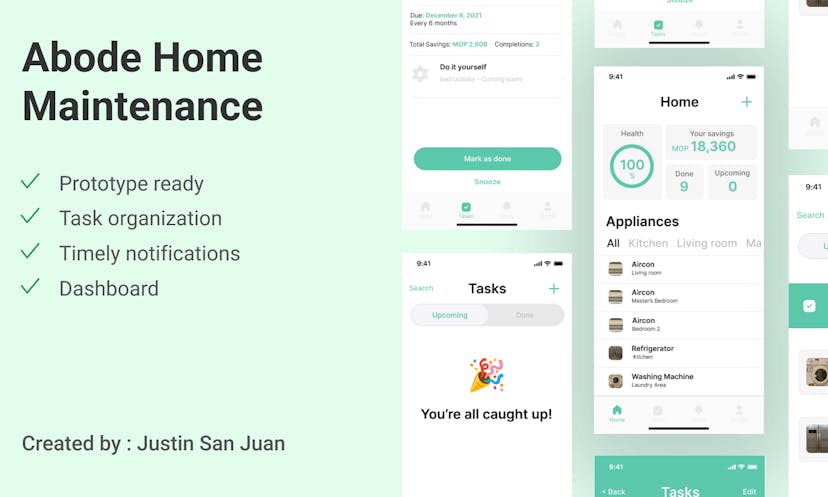
A frictionless app to schedule home appliance maintenance. Users can set up their home appliances, pets, vehicles, and get timely notifications on when to maintain it.

Unify
Unify

An app for university students to find professional activities that match their interest.

Song Association
Song Association

A mobile social party game. A fun activity to test your lyrics knowledge!

Abigail Farm Supply Website

An interactive responsive company website with custom display components on WordPress.

My Garden Online
My Garden Online

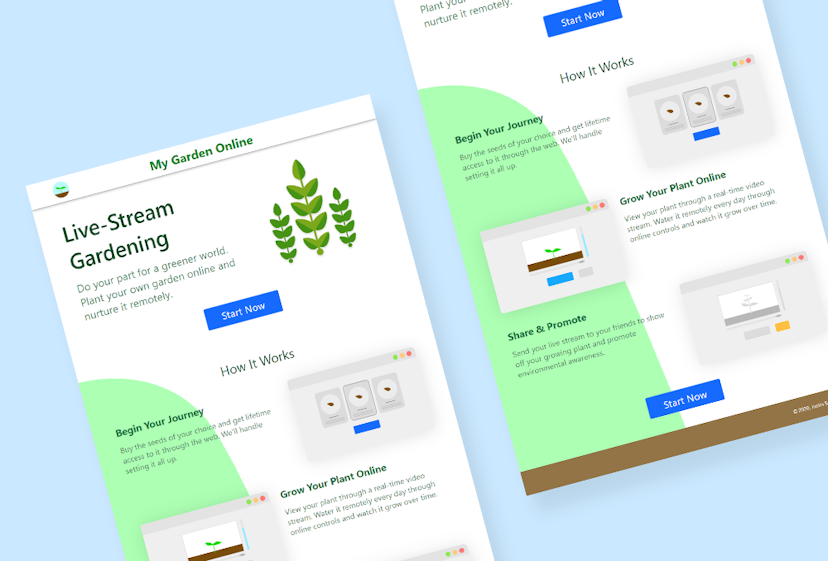
Live-stream every plant you buy. Take care of your garden with water and fertilizer from the comfort of your home online.

Backend & AutomationI love automating and designing for scale
Distributed Concurrent Image Processing

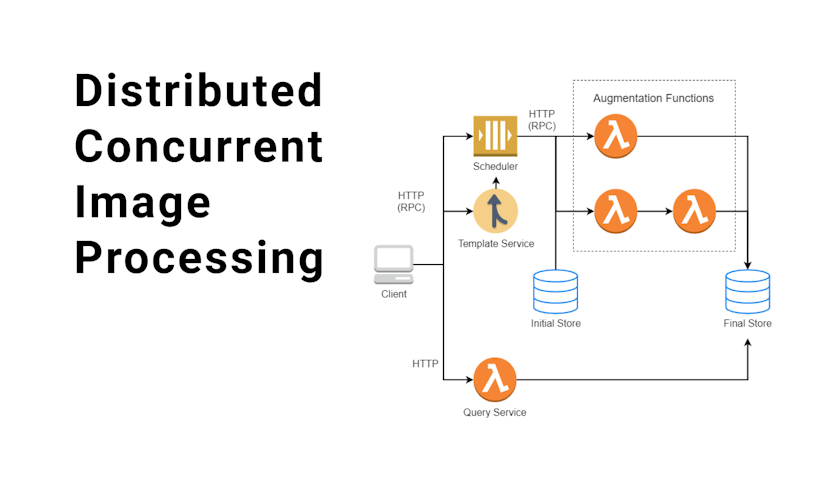
Scalable Kubernetes & Docker distributed system for mass-processing of image payloads. Developed to process 10,000+ images for testing scheduling algorithms.

Pose & Object Recognition AI Deployment System

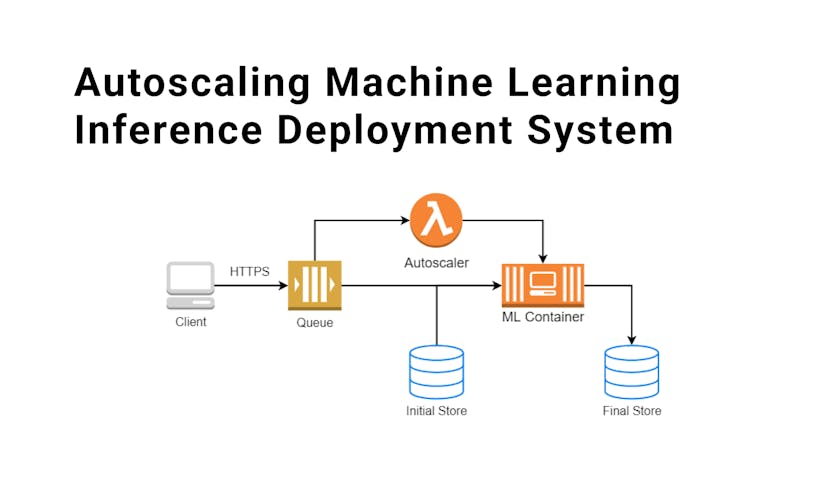
Autoscaling machine learning inference deployment system serving over 100,000 customers.

Object Recognition for Civil Engineering Sketches

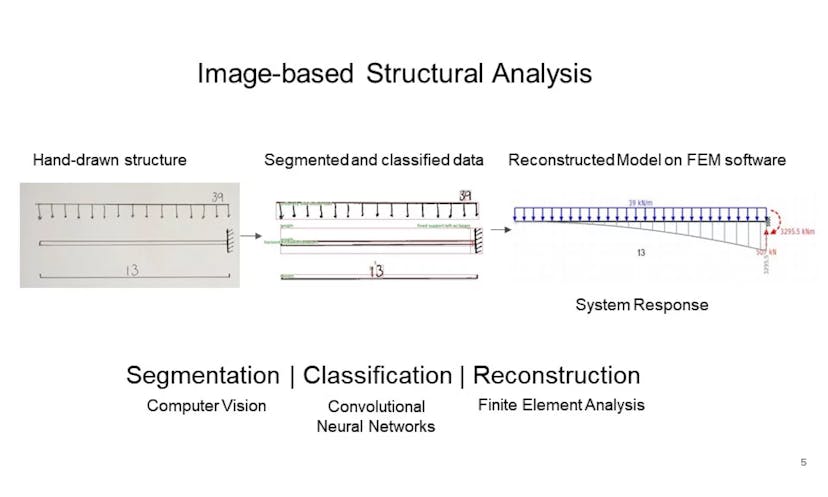
Novel Tensorflow architecture developed to recognize components and numbers in hand-drawn Civil Engineering sketches.

WhatsApp Team Inbox
WhatsApp Team Inbox

Commercial WhatsApp Business API Solution with over 10,000 messages sent a day per client.

QuantConnect Trading Algorithm

Production-environment trading algorithm with pipelined optimization for Probabilistic Sharpe Ratio build on QuantConnect.

ZoomInfo, Salesforce, and Salesloft Sales Outreach Automation

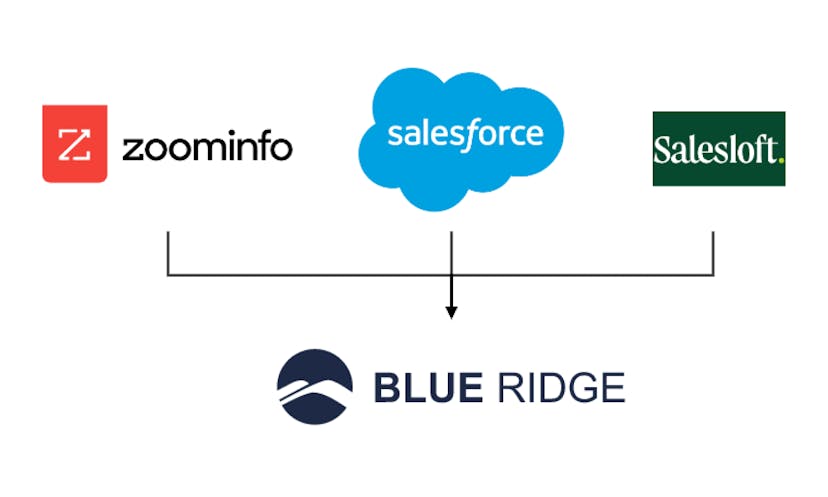
Client-based automation for parsing, filtering, and establishing high-value leads for Blue Ridge Global.

Open Source ContributionsI also contribute to open-source projects
React Awesome Popups

A lightweight, extendable, fast performing, highly customizeable, production ready React Component that renders an animated set of popups.

React Native Animated Tab Bar

Animated Sliding Tab Bar for React Native. This project supports 2+ tabs with an animated bar to switch between the tabs. This project uses Expo. Inspired by Aditya Signh's original version.

Open Source Contributions

Other open source contributions I have made.

ResearchMeticulously-studied papers I have written
Reducing the Cost of GPU Cold Starts in Serverless Deep Learning Inference Serving

2023 · The rapid growth of Deep Learning (DL) has led to increasing demand for DL-as-a-Service. In this paradigm, DL inferences are served on-demand through a serverless cloud provider, which manages the scaling of hardware resources to satisfy dynamic workloads. This is enticing to businesses due to lower infrastructure management costs compared to dedicated on-site hosting. However, current serverless systems suffer from long cold starts where requests are queued until a server can be initialized with the DL model, which is especially problematic due to large DL model sizes. In addition, low-latency demands such as in real-time fraud detection and algorithmic trading cause long inferences in CPU-only systems to violate deadlines. To tackle this, current systems rely on over-provisioning expensive GPU resources to meet low-latency requirements, thus increasing the total cost of ownership for cloud service providers. In this work, we characterize the cold start problem in GPU-accelerated serverless systems. We then design and evaluate novel solutions based on two main techniques. Namely, we propose remote memory pooling and hierarchical sourcing with locality-aware autoscaling where we exploit underutilized memory and network resources to store and prioritize sourcing the DL model from existing host machines over remote host memory then cloud storage. We demonstrate through simulations that these techniques can perform up to 19.3× and 1.4× speedup in 99th percentile and median end-to-end latencies respectively compared to a baseline. Such speedups enable serverless systems to meet low-latency requirements despite dynamic workloads.

A Deep Reinforcement Learning approach for Optimizing Function Allocation in Serverless with a Distributed Image Registry

2022 · The emergence of the Function-as-a-Service (FaaS) paradigm enables software developers to focus on business logic all the while entrusting the service provider in a serverless environment to elastically scale up during a burst of requests or scale down when request rates are low. One of the key enablers of FaaS is the widespread adoption of containerization technology such as Docker, which packages software into images that can be loaded and executed in any other computer running the Docker engine. An encumbering limitation of FaaS is significant overhead when downloading these images to newly instantiated workers from a centralized image repository. Large bursts of requests cause new workers to be instantiated and lead to so-called "cold-start" latencies. Recent works have investigated distributed image registries in the flavor of downloading images from existing workers and the scheduling of functions with knowledge of the server resource availability and function request information separately. However, the scheduling of functions in servers distant from existing images can lead to sub-optimal function completion times, especially in the context of a bursty workload. FaaSFabric addresses these issues by incorporating the information of image locations into the scheduling decisions. In this paper, we present fine-grained overhead breakdowns of workload traces, a Mixed Integer Linear Program (MILP) formulation of incorporating distributed image registry information in request allocation decisions, a justification of the potential of Deep Reinforcement Learning (DRL), and a proposed DRL formulation. We also demonstrate that in a simple workload, image pulling can take up to 80% of the total function completion time on average, which shows the potential for a distributed image registry-aware scheduler to outperform baseline and state-of-the-art schedulers.

Tailoring Product Recommendations for Mobile Devices

2022 · Since the beginning of the COVID-19 pandemic, online shopping has grown at a rate not seen before. Because of this, it is pertinent to display product recommendations in a way that makes it easy for users to understand what they are looking at and find what they need. Currently, there exists a lack of research on how to tailor the display of these recommendations to different devices. This is especially important for mobile devices where there is significantly less space to display all of the necessary information. In this paper, we explore two factors that influence a user’s product selection decision process on mobile devices, mainly the size of the picture and amount of explanation for each product, and perform a user study to quantify the amount of influence these factors have.

Enabling Parallel Smart Contract Execution Using SGX

2021 · Decentralized applications built using smart contracts are skyrocketing. These applications take advantage of blockchain’s availability and security guarantees. However, blockchains have failed to cope with the increase in adoption because of inherent limited scalability and poor throughput. This prevents mainstream adoption of application execution on blockchain. In this paper, we present SLAB, a novel smart contract architecture that addresses these limitations by proposing parallel smart contract execution. We separate computation from consensus layer and leverage Intel SGX to scale transaction execution. SLAB uses three major concepts for optimization. First, we use smart locks and dependency tree to enable transaction execution in parallel. Second, by utilizing the trust properties of Trusted Execution Environments (TEEs), SLAB eliminates redundant transaction execution. Third, we support complex smart contract to smart contract calls by smart allocation of transactions and communication between compute nodes. We claim that our system is highly scalable. And, as compared to ethereum, we expect a many-fold increase in system throughput.

Data Privacy in Blockchain using Intel SGX: A Systematic Literature Review

2021 · Data privacy is an important issue for businesses, governments, and the general public. Blockchain is an emerging technology that decentralizes trust among a number of potentially malicious peers in comparison to centralized systems. One of the challenges for blockchain systems is to provide privacy while providing high transaction throughput. Intel Software Guard Extensions (SGX), and other Trusted Execution Environments (TEEs) provide trust guarantees when executing a piece of code. Through this technology, several aspects of blockchains can be anonymized, thus preserving data privacy . In this paper, we present a systematic literature review of blockchain systems that use data privacy techniques with a focus on applications of Intel SGX.

Image Processing using Serverless Functions

2020 · One of the largest barriers to entry in machine learning is the scarcity of data. Several steps are involved in machine learning model creation, particularly, data collection, data preparation, choosing a model, training, etc. The project focuses on the step of data preparation, namely data augmentation, and specifically in the area of image processing. However, the framework proposed is extensible toward other data type, such as text, and video. Data augmentation is the creation of data from primary data samples using well-established transformations, such as rotations, pepper-salt distortions, etc. to create more samples for training a machine learning model. More notably, serverless computing, which involves a platform distributing processes across different transient servers, is increasingly a popular method in computing as it streamlines the setup of acquiring and establishing hardware, networks, etc. The project proposes framework that establishes a programming interface for serverless functions to be called to process the data.

T-Music Web System
T-Music Web System

2020 · T-Music is an innovative algorithm that composes a series of musical notes from a given series of input lyrics using frequent pattern mining as well as other data mining techniques. To demonstrate the capabilities of the algorithm, an online interface is desired for access to the public. The project identifies the user interactions required for T-Music and establishes a web interface for online access. The result of the project is an implementation of system design concepts to allow a maintainable and scalable system to deploy the usage of the algorithm.

Comprehensive Analysis of Water Supply Shortage and Solutions in California

2017 · Water is a very precious resource, it supports the lives of billions of people. However, due to a series of problems, water shortage becomes more prominent. [1]. This shortage causes not only economic slowdown, but also mortal illnesses and regional conflicts. Water shortage is occurring more frequently around the world in both developing and developed countries and arouses interest in its causes. This report will study water shortage in California. According to the California Department of Water Resources, the water demand in California mainly comprises of three domains in which 50% is for environmental use, 40% is for agricultural use, and 10% is for urban use [2]. For environmental use, the water is mainly for preservation of the ecology in some protected regions under the federal and states laws, and for maintaining the water quality for agricultural and urban uses [2]. Although environmental use is related to the hydrology in California, it indirectly affects human activities and significantly consume the water as compared to other uses – mainly agriculture. In the last few decades, due to the increasing yield of crops, and the switch to perennial crops [2], water usage dropped slightly for the industry. However, agricultural industry still relies on stable water supply heavily in order to produce good-quality, profitable crops. Being one of the major industries in California, which contributes to approximately 2% of the GDP of the state, together with other derived production profits [3], the water supply plays an important role in sustaining the economy of the industry and California. By comparing climate and agricultural data to the drought level in California as defined by the United States Drought Monitor (USDM), this report will provide an analysis of the causes of water shortage in California and compare and suggest solutions to mitigate the issue.

ArticlesWhen I'm not writing code, I write articles
A practical guide to 10× your value using an ease/impact matrix
business strategypractical guides10x engineerprioritizationbusiness consulting
At any point in our lives, we should be aiming to make the most value out of our efforts. Whether value is defined as maximizing your salary, personal enjoyment, or chances of a successful startup, we want to find out what the best actions are to take to move ourselves as far as possible forward in our lives.Photo by JESHOOTS.COM on UnsplashWe want to propel ourselves forward as best as we canFor example, we would not want to spend 3 months of our lives working on a project in a company that just accomplishes one thing for one client if we could execute on another venture that can impact more customers in the same amount of time, or can be done more easily.If you cut off all the tasks in your work that have low potential for impact or are too difficult to do, then you can 10× the value of all of your effort.There are many other articles on what an ease/impact matrix is, but none of them guide you in filling one out. This one does.The challenge is uncertaintyEven if you have a number of options, for example, project A, B, and C, that each have different potentials and effort needed, in most cases, it is difficult to say which is the best one right off the bat.The source of mistakes when picking our course of action is uncertainty of either the impact or the ease of implementation of for a project. Our goal then should be to minimize uncertainty.In this article, a potential project is a direction or rough idea aimed at solving a specific problem.The rest of this article is written in likeness of a troubleshooting article, which lists practical steps to identifying the best action to take.An ease/impact matrix plots projects in the dimensions of ease and impact, but how do we define these?A blank Ease/Impact matrixTo start placing items on the graph, we need to ask two questions: how impactful is it? and how easy is it to complete?Here are a few helpful questions to ask when determining “impact”:Is it a novel, structural architectural change? If yes, there is a better chance that it will have a huge impact.How much people are impacted by it?How frequently are people impacted by it?Are people spending money on this problem already / is there a good history validating that this problem exists?Meanwhile, here are some questions to ask when determining “ease”:What is a good set of date ranges to divide these tasks? Set at most 3 ranges of dates such as: up to 1 week, up to 4 weeks, over 4 weeks.How long can you do it? This is primarily based on your experience and intuition.Can someone else do it for you?How long can someone else do it?Remember to keep it simpleAfter placing a few items down, it may be tempting to ask whether working on some project will make other projects easier, but it is often more important to focus on the items individually to make a decision sooner than later.What if you are still unsure?If you have a gut feeling and indecisiveness on how impactful or easy a project is, treat it as a signal to get more information.Ways you can get more information for impact include:Ask relevant audience members about their experience with the problem.Look up relevant numbers such as potential market size, current spendings.Estimate the benefit by modelling the effect of a project in an equation. For example, if a project can reduce the time for customers waiting in line, we can design an equation that outputs how much added revenue (sales) can be acheived for some amount of reduction in time.To get a better idea of ease:Ask experienced workers that have implemented similar projectsResearch relevant durations if possible. For example, you can search the duration of some related projects in freelance websites.Look at the cost of similar projects as another signal on ease of implementation.When should you pick off a project?Once you have plotted each of your current potential projects, you can then think of picking one. However, the only time you should pick off a project at this point in time is when you have one on the top-right corner of the matrix.If not, it may be a good idea to take time and identify more potential projects.Meanwhile, if you already believe you have all your choices on the board, you may think about picking a project on the top area or the right side of the chart.If the project is on the top area and more towards the left, you believe the project has potential for high impact but can be difficult to achieve. You may then consider onboarding more experienced people to work on the project.If the project is on the right side of the graph and more towards the bottom, you may want to consider delegating to lower-cost labour, or automating it.Do this regularly and you will develop intuitionThe first time you use an ease/impact matrix is not necessarily easy. You may find that there are a lot of unknowns. However, the more you use it, the faster you will be as you develop intuition for different problems and their relevance to your projects.Overall, it is important to identify what your next actions should be to maximize your value.ConclusionThis article describes practical steps and questions to ask yourself in order to use an ease/impact matrix. The matrix helps you prioritize what your next action should be to maximize the value you create.If you enjoyed this article or learned something from it, I would greatly appreciate your clap!If you have anything to suggest, let me know in the comments or message me on LinkedIn.

Dec 2nd, 2022

How to Create a Simple Alert for Long-Running Jobs
software engineeringdata sciencemachine learningpythonalerts
If you are tired of executing long-running commands and having to wait idly for the result, you can set up a simple alert system to get notified when the task is finished.Photo by rhoda alex on UnsplashWhether you are running a long Machine Learning training task, analyzing a load of data, or executing a long simulation, this alert enables you to step away from the computer and get notified when to come back.In this article, I show you how to install a simple Python script that will send you a message on a Slack channel, Discord channel, or anything else. I use this often in my work and I hope it will be useful to you too.This guide is created for Linux, but can also be installed for Mac or Windows as long as you can get Python.The alert works by using the knockknock library in Python. The main alert file in the repository is only 17 lines of code!Set up the alert in 6 easy steps1. Clone the repository anywhere in your computergit clone https://github.com/justinsj/alert-git2. Install the requirementssudo pip install setuptools-rustpython -m pip install — upgrade pippython -m pip install -r requirements.txt3. Set up your Slack webhook URL.To do this, check out https://api.slack.com/messaging/webhooks.4. Change the SLACK_WEBHOOK_URL and DEFAULT_SLACK_CHANNEL in alert.In the file alert , update the variables to your webhook URL and default channel.# alertSLACK_WEBHOOK_URL = 'https://hooks.slack.com/services/T0JQQQQQQ/B0JQQQQQQ/XXXXXXXXXXXXXXXXXXXXXXXX'DEFAULT_SLACK_CHANNEL = 'your-slack-channel'5. Ensure that the alert code is executablechmod +x alert6. Copy the file to an easily accessible location like ~/alert.cp alert ~/alertNow you can use ~/alert with any long task!For example, from any folder, you can do:~/some-folder$ python some_long_task.py && ~/alertFinally, you can set a custom message after the ~alert command:~/alert helloConclusionIn this article, I have written about a simple alert system that I personally use often and install in almost every machine I work with.If you enjoyed this article or learned something from it, I would appreciate your clap!If you also have anything to suggest, let me know in the comments or message me on LinkedIn!

Nov 25th, 2022

How to Implement the Builder Pattern in Python for Automating SQL Dashboard Analytics
software engineeringpythonsqldata sciencedesign patterns
In this article, I discuss the design and implementation of an SQL Builder in Python. The main benefit of this pattern is saving plenty of development time in making domain-specific queries. In addition, the builder pattern allows flexibility in where and when information is added to the query.Most SQL builder libraries are built to support SQL-like statements in different languages. However, builders that can truly automate queries for companies can only be developed in-house because public libraries will always be designed to only solve general problems.Through this article (source code available below!), you will be able to create your own custom SQL builder with syntax such as the following example where we want to get the number of cars sold in the past 24 hours.sql = ( AdvancedSQLBuilder().SELECT("NAME").SELECT("COUNT(*)") .FROM("CARS").WHERE("NAME = 'BMW'") .ORDER_BY("COUNT(*)").HOURS("SELL_DATE", 24) .GROUP_BY("NAME") .BUILD() )print(sql)To output the following:SELECT NAME, COUNT(*)FROM CARSWHERE NAME = 'BMW'AND SELL_DATE >= DATEADD(HOUR, -24, GETDATE())GROUP BY NAMEORDER BY COUNT(*)The above result uses MS SQL Server, but can be adapted for any SQL database.MotivationThe naive way to instantiate an object of a class uses the following format:class MyClass: def __init__(self, item_a, item_b, item_c): self.a = item_a self.b = item_b self.c = item_c# Exampleobj = MyClass(1, 2, 3)All is well using this method of object instantiation until we do not need to supply all of the values of a, b, c during instantiation. An example of this is when creating SQL statements.A similar method of designing an SQL statement object may be the following:class SQLStatement: def __init__(self, select_properties, from_tables, where_conditions, group_by_clause, having_conditions): self.select_properties = select_properties self.from_tables = from_tables self.where_conditions = where_conditions self.group_by_clause = group_by_clause self.having_conditions = having_conditions def __repr__(self): return f"""SELECT {self.select_properties}FROM {self.from_tables}WHERE {self.where_conditions}GROUP BY {self.group_by_clause}HAVING {self.having_conditions}"""# Examplesql = SQLStatement("NAME", "CARS", "COLOR = 'blue'", "","")print(sql)This outputs:SELECT NAMEFROM CARSWHERE COLOR = 'blue'GROUP BY HAVING In the case above, we have an SQLStatement class that takes a required 5 arguments of select, from, where, group by, and having clauses. When we do not need to use the other arguments such “group by” and “having” as in the example, we need to put an empty argument. We can also adjust this class to use optional arguments, but that becomes messy very quickly.The Builder PatternThe builder pattern can be best described with a simple example:class MyBuilder: def __init__(self): self.a = None self.b = None self.c = None def a(self, arg): self.a = arg return self def b(self, arg): self.b = arg return self def c(self, arg): self.c = arg return self def build(self): list_of_values = [self.a, self.b, self.c] list_of_values = [i for i in list_of_values if i is not None] return list_of_values.join(",")# ExamplemyBuilder = MyBuilder().b(1).a(2)print(myBuilder.build())# Outputs: 1,2The above example demonstrates the builder pattern, which has the following properties:Functions that set a class variable should return self. This allows chaining commands such as in the example.The class should have a build() function (or any other name). This function should consume the information of all the variables that were set before calling it and return the desired output while handling missing information.The setter functions can be called in any order.Let’s build the SQL builder!Now that we know how to use the builder design pattern, we can use it to create a domain-specific SQL builder.The goal of this builder is to make the process of aggregating data easier for any type of process. This is particularly useful for building queries for dashboards if we add the ability to restrict results within specific date ranges, segment different groups, etc.First, we need a baseline SQL builder:# SQLBuilder.pynewline = "\n"class SQLBuilder(object): def __init__(self): self._DECLARE = "" self._SELECT = "" self._FROM_MAP = {} self._WHERE = "" self._ORDER_BY = "" self._GROUP_BY = "" self._HAVING = "" def DECLARE(self, key, type, value = ''): assert(key.startswith('@')) # Handle keyword starting with declare s = "\n" if (self._DECLARE == ""): s = "" self._DECLARE += s + f"DECLARE {key} {type}{' = ' if value else ''}{value}" return self def SELECT(self, t): s = ", " if (self._SELECT == ""): s = "SELECT " self._SELECT += s + t return self def FROM(self, t, alias=''): if (not t in self._FROM_MAP): self._FROM_MAP[t] = '' if (alias): self._FROM_MAP[t] = alias return self def WHERE(self, t): if (self._WHERE != ""): return self.AND(t) self._WHERE = "WHERE " + t return self def AND(self, t): s = "\n" if (self._WHERE == ""): s = "WHERE 1=1\n" self._WHERE += s + f"AND {t}" return self def GROUP_BY(self, t): s = ",\n" if (self._GROUP_BY == ""): s = "GROUP BY " self._GROUP_BY += s + t return self def ORDER_BY(self, t): s = ",\n" if (self._ORDER_BY == ""): s = "ORDER BY " self._ORDER_BY += s + t return self def HAVING(self, t): s = ",\n" if (self._HAVING == ""): s = "HAVING " self._HAVING += s + t return self def JOIN(self, table_one, key_one, table_two, key_two): return self.FROM(table_one).FROM(table_two).AND(f"{table_one}.{key_one} = {table_two}.{key_two}") def BUILD(self): self._FROM = ', '.join([f"{name}{f' {alias}' if alias else ''}" for name, alias in self._FROM_MAP.items()]) return ( f"{self._DECLARE + newline if self._DECLARE else ''}" + f"{newline + self._SELECT if self._SELECT else ''}" + f"{newline + 'FROM ' + self._FROM if self._FROM else ''}" + f"{newline + self._WHERE if self._WHERE else ''}" + f"{newline + self._GROUP_BY if self._GROUP_BY else ''}" + f"{newline + self._HAVING if self._HAVING else ''}" + f"{newline + self._ORDER_BY if self._ORDER_BY else ''}" )An example of using this base class is to find the count of entries in a table CARS that has the NAME equal to ‘BMW’.from SQLBuilder import SQLBuilderprint( SQLBuilder() .SELECT("NAME").SELECT("COUNT(*)") .FROM("CAR_SALES", "C") .WHERE("C.NAME = 'BMW'") .ORDER_BY("COUNT(*)") .BUILD())This outputs:SELECT NAME, COUNT(*)FROM CAR_SALES CWHERE C.NAME = 'BMW'ORDER BY C.COUNT(*)We can now add special helper functionsThese helper functions can include:HOURS(key, n) to limit the range of the key up to n hours ago.TODAY(key) to limit the values of key to be within today.START_DATE(key, start_date) to limit the lowest value of key to start_dateEND_DATE(key, end_date) to limit the highest value of key to end_dateLIKE(key, s) to add a WHERE condition that key is a string like s.NULL(key) to add a WHERE condition that the value of key is null.NOTNULL(key) to add a WHERE condition that the value of key is NOT null.etc.# AdvancedSQLBuilder.pyfrom SQLBuilder import SQLBuilderclass AdvancedSQLBuilder(SQLBuilder): def HOURS(self, key, n): assert(n > 0) self.AND(f"{key} >= DATEADD(HOUR, -{n}, GETDATE())") return self def TODAY(self, key): self.AND(f"CONVERT(VARCHAR(10), {key}, 102) = CONVERT(VARCHAR(10), GETDATE(), 102)") return self def START_DATE(self, key, start_date): (self.DECLARE('@start_date','datetime',start_date) .AND(f"{key} is not null") .AND(f"{key} >= @start_date")) return self def END_DATE(self, key, end_date): self.DECLARE('@end_date','datetime',end_date) self.AND(f"{key} is not null") self.AND(f"{key} < @end_date") return self def LIKE(self, key, s): self.AND(f"{key} like '{s}'") return self def NULL(self, key): self.AND(f"{key} is null") return self def NOTNULL(self, key): self.AND(f"{key} is not null") return selfAn example of using this is then to find the number of cars sold last year:from AdvancedSQLBuilder import AdvancedSQLBuilderprint( AdvancedSQLBuilder() .SELECT("NAME").SELECT("COUNT(*)") .FROM("CAR_SALES") .START_DATE("SELL_DATE", '2021-11-18 00:00:00') .END_DATE("SELL_DATE", '2022-11-18 00:00:00') .ORDER_BY("COUNT(*)") .GROUP_BY("NAME") .BUILD())This outputs:DECLARE @start_date datetime = 2021-11-18 00:00:00DECLARE @end_date datetime = 2022-11-18 00:00:00SELECT NAME, COUNT(*)FROM CAR_SALESWHERE 1=1AND SELL_DATE is not nullAND SELL_DATE >= @start_dateAND SELL_DATE is not nullAND SELL_DATE < @end_dateGROUP BY NAMEORDER BY COUNT(*)We can achieve even more with this patternGoing into domain-specific examples, suppose our database uses ID numbers for our car names instead of a string in the following:# Example database table: # CARS+------------+--------+----------------+| PRIMARY_ID | CAR_ID | SOME_VALUE |+------------+--------+----------------+| 1 | 103112 | some_value || 2 | 103113 | another value || ... | ... | ... |+------------+--------+----------------+# CAR_MAP+--------+---------------+| ID | CARNAME |+--------+---------------+| 103112 | BMW || 103113 | Aston Martin || ... | ... |+--------+---------------+We can add an automatic mapping function so that we can filter by car name:# DomainSpecificSQLBuilder.pyfrom AdvancedSQLBuilder import AdvancedSQLBuilderclass DomainSpecificSQLBuilder(AdvancedSQLBuilder): def CARNAME(self, name, table_two, key_two): self.JOIN("CAR_MAP","ID", table_two, key_two) self.AND(f"CAR_MAP.NAME = {name}"An example of using this is to get all the names of cars with more than 30 sales:from DomainSpecificSQLBuilder import DomainSpecificSQLBuilderprint( DomainSpecificSQLBuilder() .SELECT("CARNAME").SELECT("COUNT(*)") .FROM("CAR_SALES") .CARNAME("BMW", "CAR_SALES", "CAR_ID") .WHERE("COUNT(*) > 30") .BUILD())This outputs the following:SELECT CARNAME, COUNT(*)FROM CAR_SALES, CAR_MAPWHERE 1=1AND CAR_MAP.ID = CAR_SALES.CAR_IDAND CAR_MAP.NAME = BMWAND COUNT(*) > 30ConclusionIn this article, I have shown how to use the builder pattern to create a domain-specific SQL builder. This can then be used to programmatically generate SQL queries for different slices of data, allowing swift gathering of data for business dashboards and general analysis.GitHub RepositoryFeel free to check out the source code here: https://github.com/justinsj/sql-builderIf you enjoyed this article or learned something from it, I would appreciate your clap!If you also have anything to suggest, let me know in the comments or message me on LinkedIn!

Nov 18th, 2022

How To Implement the Interpreter Design Pattern for Messy Data in Python
pythonsoftware engineeringdata sciencedesign patternsdata visualization
An in-depth guide to help you get more out of your dataThis article describes how you can implement the Interpreter design pattern to read messy data.Figure 1. Top 25% of company coop salariesFigure 1 shows the average coop salaries of the top 25% of companies reported by students at the University of Waterloo. I will show you how to get to this graph step by step in this article.The Interpreter Pattern Can Read With GrammarIt is usually used to evaluate mathematical text such as “32 * 5 + 23”. The usefulness of this pattern lies in how it performs arbitrary combinations of operations with a relatively simple set of rules.Figure 2. The Interpreter design patternThe Interpreter design pattern is shown in Figure 2. It starts with a client that maintains a reference to a context, for example, the string “32 * 5 + 23”.The bulk of the design pattern is then the AbstractExpression, which declares that all objects of this type should have an interpret(Context) function.The classes that extend/inherit from the AbstractExpression then are two main types:TerminalExpression, also known as a LiteralExpressionNonTerminalExpression, which may contain references to AbstractExpressionsOur implementations of these will be described later.Analyze the data for manually-reported salaries for coopOur goal is to rank companies by the reported salaries, according to a megathread on Reddit for the University of Waterloo students.Source code at the end of the article!The data contains the reported salaries for Spring 2021 and Fall 2021.Here is an example of the data:1password: 25/h (1st coop), 32/hr (3rd coop), 42/hr (5th coop?)Accedo: 24/hr (3rd coop)⁠Achievers inc: 20-25/hr⁠ADP: less than 44/hrAGF: 18.50/hrAkuna Capital: 65 USD/hour + return flight + corporate housingAmazon: $7912/mo + 1875 USD/mo stipend + relocation(?)AMD: 27/hrAmerican Express: 34.5/hr⁠Apple: (34/hr + 1300-1500 stipend/month) (37/hr + 1350 stipend for 3A term)Arctic Wolf: 20% above coop average, 23/hr (1st coop), 34/hr (4th coop)Athos: 5000 USD/moAtolio: 34/hr (3rd coop), 38/hr (5th coop), 42/hr (6th coop)⁠Autodesk: 24-30/hr...The problem is that there are many different formats used. Here’s a few of them:X/hrX/moUSD X/monthX/hr (1st coop), Y/hr (3rd coop), Z/hr (5th coop)etc.We want to compare salary rankings using CAD/moTo compare salaries, we need to use the same units, and for this example, we will convert the salaries to Canadian Dollars (CAD) every month.We use the following assumptions to simplify the problem:We take the average for range values (e.g., 20–25/hr → 22.5/hr)We take the average for different coop term pays ( “34/hr (3rd coop), 38/hr (5th coop), 42/hr (6th coop)” → 38/hr )The coop average is CAD 30.0/hrDefine the AbstractExpressionTo tackle the problem, we first define the AbstractExpression as follows:# expressions.pyclass AbstractExpression(object): def __init__(self): ''' Returns None. __init__: None -> None ''' pass def interpret(self): ''' Returns the value of the expression. interpret: AbstractExpression -> float ''' return 0 def __repr__(self): ''' Returns the string representation of the evaluated. __repr__: AbstractExpression -> str ''' return str(self.interpret())Note that we make interpret() a zero-argument function that returns a floating-point value. We assume that the necessary contexts are stored when the object is created. This is visible in the next section.A TerminalExpression usually refers to a single evaluated numberWe define it as follows:# expressions.pyclass LiteralExpression(AbstractExpression): def __init__(self, string): ''' Returns None. __init__: str -> None ''' self.string = string def interpret(self): ''' Returns the value of the expression. interpret: LiteralExpression -> float ''' return float(self.string)# Example:LiteralExpression("32").interpret() # This returns the value 32Let’s define an AddExpressionNow that we have the base case, LiteralExpression, let’s add a simple addition operation to our interpreted language:# expressions.pyclass AddExpression(AbstractExpression): def __init__(self, left, right): ''' Returns None. __init__: AddExpression -> None ''' self.left = left self.right = right def interpret(self): ''' Returns the value of the expression. interpret: AddExpression -> float ''' return self.left.interpret() + self.right.interpret()# Example:AddExpression(LiteralExpression("5"), LiteralExpression("6")) # Returns 11The add operation takes two AbstractExpression objects to create. If we initialize it with two LiteralExpressions for 5 and 6, then the result we get from interpret() is 11.The great thing about this is that the two input objects do not have to be LiteralExpressions. They can be other composite expressions such as MultiplyExpression or more AddExpressions.Now we need a SubtractExpressionAlmost exactly like the AddExpression, but we perform subtraction in interpret().# expressions.pyclass SubtractExpression(AbstractExpression): def __init__(self, left, right): ''' Returns None. __init__: AbstractExpression AbstractExpression -> None ''' self.left = left self.right = right def interpret(self): ''' Returns the value of the expression. interpret: SubtractExpression -> float ''' return self.left.interpret() - self.right.interpret()We also need to define MultiplyExpression# expressions.pyclass MultiplyExpression(AbstractExpression): def __init__(self, left, right): ''' Returns None. __init__: AbstractExpression AbstractExpression -> None ''' self.left = left self.right = right def interpret(self): ''' Returns the value of the expression. interpret: MultiplyExpression -> float ''' return self.left.interpret() * self.right.interpret()Now, in our case, we do not need a division expression, but it should be trivial now to create.We also define a few other expressions# expressions.pyclass PercentAboveExpression(AbstractExpression): ''' X% above Y --> (Y) * (1 + X) ''' def __init__(self, left, right): ''' Returns None. __init__: AbstractExpression AbstractExpression -> None ''' self.left = left self.right = right def interpret(self): ''' Returns the value of the expression. interpret: PercentAboveExpression -> float ''' return (self.right.interpret()) * \ (1 + self.left.interpret() / 100.0)# expressions.pyclass AverageExpression(AbstractExpression): def __init__(self, array): ''' Returns None. __init__: (list AbstractExpression) -> None ''' self.array = array def interpret(self): ''' Returns the value of the expression. interpret: AverageExpression -> float ''' sums = list(filter( lambda x: x != 0, [x.interpret() for x in self.array] )) return sum(sums) / len(sums) if (len(sums) > 0) else 0In our case, we need to define two additional expressions:PercentAboveExpression, to calculate text such as “20% above coop average”AverageExpression, to calculate the average of “20–25/hr” and “34/hr (3rd coop), 38/hr (5th coop), 42/hr (6th coop)”Add a parserNow that we have defined the AbstractExpression and its implementations, we need to write a function that converts an input string to Expression objects.To do this, we utilize some properties of the problem. Namely, our goals are to:Remove unnecessary textConvert variations of phrases such as /year, /yr, and /y to the same valueInterpret phrases to convert them into the correct expressionsWe first define the following constants in a constants.py file:# contants.pyPER_HOUR = 1PER_HR_TO_PER_MO = 40 * 4.34524 # 40 hrs a week, 4.34524 wks a monthPER_MO_TO_PER_HR = ( # working hours in a month 1 / PER_HR_TO_PER_MO) PER_YEAR_TO_PER_HR = ( # working hours in a year 1 / (12 * PER_HR_TO_PER_MO)) PER_WEEK_TO_PER_HR = 1 / 40 # working hours in a weekSTIPEND_TO_PER_HR = ( # 4-month co-op 1 / 4 / PER_HR_TO_PER_MO) COOP_AVERAGE = { "2021": { "F": "30.0", "S": "30.0" }}CURRENCY_CONVERTER = { "CAD": 1, "USD": 1.26, "¥": 0.01094}INPUT_FOLDER = "inputs"OUTPUT_FOLDER = "outputs"Then, we define the text-cleaning functions remove_articles(string) and remove_symbols(string)# helpers.pydef removeSymbols(string): ''' Returns a string with all symbols removed. remove_symbols: Str -> Str ''' string = string.replace("$", "") string = string.replace("\"", "") string = string.replace("~", "") return stringWe then create a function to convert currencies called convert_currency(string)# helpers.pydef convert_currency(string): ''' Returns a string with all currencies converted to CAD. convert_currency: Str -> Str ''' # For each key in CURRENCY_CONVERTER, replace with value for key in CURRENCY_CONVERTER: lowered_key = key.lower() uppered_key = key.upper() # Special case for yen if lowered_key == "¥": string = string.replace( lowered_key, f"{CURRENCY_CONVERTER[uppered_key]} * " ) else: string = string.replace( lowered_key, CURRENCY_CONVERTER[uppered_key] ) return stringWe also define a function to convert variations to a common value fix_variations(string)# helpers.pydef fix_variations(string): ''' Returns a string with all variations such as /year, /yr /y replaced with multiplications with numbers. fix_variations: Str -> Str ''' # /yr string = string.replace("/year", f" * {PER_YEAR_TO_PER_HR}") string = string.replace("/yr", f" * {PER_YEAR_TO_PER_HR}") string = string.replace("/y", f" * {PER_YEAR_TO_PER_HR}") string = string.replace("annual", f" * {PER_YEAR_TO_PER_HR}") string = string.replace("/annum", f" * {PER_YEAR_TO_PER_HR}") string = string.replace("/a", f" * {PER_YEAR_TO_PER_HR}") # If X/hr regex (convert to /mo) string = string.replace("/hour", f" * {PER_HOUR}") string = string.replace("/hr", f" * {PER_HOUR}") string = string.replace("/h", f" * {PER_HOUR}") # Else if X/mo string = string.replace("stipend/month", f" * {PER_MO_TO_PER_HR}") string = string.replace("/month", f" * {PER_MO_TO_PER_HR}") string = string.replace("/mo", f" * {PER_MO_TO_PER_HR}") # Else if X/week or X/wk string = string.replace("/week", f" * {PER_WEEK_TO_PER_HR}") string = string.replace("/wk", f" * {PER_WEEK_TO_PER_HR}") string = string.replace("/w", f" * {PER_WEEK_TO_PER_HR}") # Else other cases string = string.replace("relocation", f" * {STIPEND_TO_PER_HR}") string = string.replace("stipend", f" * {STIPEND_TO_PER_HR}") string = string.replace("signing bonus", f" * {STIPEND_TO_PER_HR}") string = string.replace("bonus", f" * {STIPEND_TO_PER_HR}") string = string.replace("s", "") # Handle thousands string = string.replace("k", " * 1000") return stringThese helper functions can be done more concisely with regex expressions but are coded this way for easy reading.We also need one more function for getting the coop average for a given term and year. Here’s what that looks like:# helpers.pydef get_coop_average(term, year): ''' Returns the average coop salary for a given term and year as a float in CAD PER HOUR units. get_coop_average: Str Str -> Float ''' return COOP_AVERAGE[str(year)][str(term)]Now, we can use this to create the recursive function parse_expression(string)#salary_parser.pyimport refrom expressions import AbstractExpression, AddExpression, \ SubtractExpression, PercentAboveExpression, AverageExpression, \ MultiplyExpression, LiteralExpressionfrom helpers import remove_symbolsdef parse_expression(string): ''' Returns an AbstractExpression representing the given string. Requires: - string is a valid salary expression parse_expression: Str -> AbstractExpression ''' string = string.strip() # Remove symbols string = remove_symbols(string) if (string == ""): return AbstractExpression() # FIXME # parse any parenthesis if any result = re.search(r"(\(.*?\)|\(.*$)", string) if (result): resultString = result.string[result.start()+1:result.end()-1] value = parse_expression(resultString).interpret() string = string[:result.start()] + " or " + \ str(value) + " " + string[result.end():] return parse_expression(string) result = re.search(r"(\[.*?\]|\[.*$)", string) if (result): string = string[:result.start()] + string[result.end():] return parse_expression(string) if ("," in string or " or " in string): return AverageExpression([ parse_expression(s) for s in re.split(r",| or ", string) ]) if ("every add" in string): return AbstractExpression() if ("% above" in string): parts = string.split("% above") leftString = parts[0] rightString = parts[1] return PercentAboveExpression( parse_expression(leftString), parse_expression(rightString) ) if ("+" in string): parts = string.split("+") leftString = parts[0] rightString = "+".join(parts[1:]) return AddExpression( parse_expression(leftString), parse_expression(rightString) ) if ("above" in string): parts = string.split("above") leftString = parts[0] rightString = "above".join(parts[1:]) return AddExpression( parse_expression(leftString), parse_expression(rightString) ) if ("below" in string): parts = string.split("below") leftString = parts[0] rightString = "below".join(parts[1:]) return SubtractExpression( parse_expression(rightString), parse_expression(leftString) ) if ("*" in string): parts = string.split("*") leftString = parts[0] rightString = "*".join(parts[1:]) return MultiplyExpression( parse_expression(leftString), parse_expression(rightString) ) if ("to" in string): parts = string.split("to") leftString = parts[0] rightString = "to".join(parts[1:]) return AverageExpression([ parse_expression(leftString), parse_expression(rightString) ]) if (" " in string): return AverageExpression([ parse_expression(s) for s in string.split(" ") ]) if (string.replace('.','',1).isdigit()): return LiteralExpression(string) return AbstractExpression()The order of operations in the parse_expession(string) function is important to ensure multiplications occur “first” when evaluating the result.In the code above, we use keywords such as the following:% above to create a PercentAboveExpression+ to create an AddExpressionbelow for a SubtractExpression* for a MultiplyExpressionThe return value of this function is an Expression object that we can interpret().Finally, to parse the lines in the text, we have the main code, which looks like this:# main.pyimport argparseimport osimport reimport jsonimport pandas as pdfrom constants import PER_HR_TO_PER_MO, INPUT_FOLDER, OUTPUT_FOLDERfrom helpers import get_coop_average, remove_articles, fix_variationsfrom salary_parser import parse_expressionfrom plotter import plot def main(filename, term, year): ''' Returns None. Reads the file in path and gets the average salary for each company in the file for the given term and year. The function then saves this data to a csv file. Also saves a bar chart for the company salaries. Effects: - Reads the file in path - Writes to {OUTPUT_FOLDER}/output.csv and {OUTPUT_FOLDER}/output_top_25_percent.csv - Writes to {OUTPUT_FOLDER}/output.png and {OUTPUT_FOLDER}/output_top_25_percent.png Requires: - term is F, W, or S main: Str Str Str -> None ''' companies = {} path = os.path.join(INPUT_FOLDER, filename) # Ensure input folder is created if not os.path.exists(INPUT_FOLDER): os.makedirs(INPUT_FOLDER) # Perform the analysis with open(path, 'r', encoding="utf8") as f: lines = f.readlines() for line in lines: if (len(line.strip()) == 0): continue line_parts = line.split(": ") company = line_parts[0] # Word joiner character removal company = company.replace("\u2060", "") salary_string = line_parts[1].replace("\n", "") salary_string = re.sub( r"(\d),(\d{3})",r"\g<1>\g<2>", salary_string ) salary_string = salary_string.lower() salaries = [] salary_string_part = salary_string salary_string_part = remove_articles(salary_string_part) salary_string_part = fix_variations(salary_string_part) salary_string_part.replace( "coop average", get_coop_average(term, year) ) salary = parse_expression(salary_string_part).interpret() if (salary != 0): salaries.append(salary) average = ( sum(salaries) / len(salaries) \ if (len(salaries) > 0) else 0 ) average = average * PER_HR_TO_PER_MO companies[company] = {"CAD/mo": average} pd.options.display.float_format = "{:,.0f}".format df = pd.read_json( json.dumps( companies, indent=4, sort_keys=True ), orient='index' ) df = df.sort_values(by=['CAD/mo'], ascending=False) df = df['CAD/mo'].apply(lambda x: int(x)) # Ensure output folder is created if not os.path.exists(OUTPUT_FOLDER): os.makedirs(OUTPUT_FOLDER) # Save the results output_path = os.path.join(OUTPUT_FOLDER, "output.csv") df.to_csv(output_path, index_label="Company") output_path_top_25 = os.path.join( OUTPUT_FOLDER, "output_top_25_percent.csv" ) df25 = df.head(int(df.count() * 0.25)) df25.to_csv(output_path_top_25, index_label="Company") # Plot the graph plot(df, "output.png") plot(df25, "output_top_25_percent.png")if __name__ == '__main__': parser = argparse.ArgumentParser() parser.add_argument( 'filename', type=str, help="File name of input file from input folder" ) parser.add_argument('term', type=str, help="Term (F/W/S)") parser.add_argument('year', type=str, help="Year (e.g. 2021)") args = parser.parse_args() main(args.filename, args.term, args.year)In the code above, we get the per-hour average for each company, convert it to per month, then store it in a Pandas dataframe. We then export the data frame to two CSV files, the full list of ranked companies in output.csv, and the top 25 percent of companies in output_top_25_percent.csv.Now for a visualization!Finally, we plot a visualization using the following code:# plotter.pyimport osimport pandas as pdimport seaborn as snsimport matplotlib.pyplot as pltfrom constants import OUTPUT_FOLDERdef plot(df, output_filename): ''' Returns None. Plots the data in the dataframe df. Saves the output to {OUTPUT_FOLDER}/{output_filename} Effects: - Writes to {OUTPUT_FOLDER}/{output_filename} Requires: - df is a dataframe with two columns: Company and CAD/mo plot: DataFrame Str -> None ''' print(df.reset_index()) # Plot the data sns.set(style="whitegrid") fig, ax = plt.subplots(figsize=(20, 0.25 * len(df))) g = sns.barplot( data=df.reset_index(), y="index", x="CAD/mo", ax=ax, palette="blend:limegreen,dodgerblue" ) g.set_title("Average Co-op Salaries") g.set_xlabel("CAD/mo") g.set_ylabel("Company") fig.tight_layout() path = os.path.join(OUTPUT_FOLDER, output_filename) fig.savefig(path)Where to find more design patternsThis is only one of the many design patterns that show the power of Object-Oriented Programming. I have also shown how to implement the Memento pattern in another article. If you want to learn more about Design Patterns, I highly recommend the book Design Patterns: Elements of Reusable Object-Oriented Software by Erich Gamma et al. (The Gang of Four). I would go so far as to call it the bible of programming.GitHub RepositoryFeel free to check out the source code here: https://github.com/justinsj/interpreter-coop-salariesStay tuned for more if you enjoyed this article or learned something from it!If you also have anything to suggest, let me know in the comments or message me on LinkedIn!How To Implement the Interpreter Design Pattern for Messy Data in Python was originally published in Better Programming on Medium, where people are continuing the conversation by highlighting and responding to this story.

Nov 11th, 2022

How much do you earn from a master’s or doctoral degree?
educationgraduate schoolfinancial freedompersonal financefinancial planning
Graduate degrees such as a master’s and doctoral (PhD) degree can be a great financial investment, but by how much?In this article, I break down the costs and benefits of graduate degrees and look at ways to justify (or reject) this option. In particular, I focus on my experience from my thesis-based Master of Mathematics in Computer Science program at the University of Waterloo. Nonetheless, the insights written here also apply for doctoral degrees.Figure 1. Projection of savings comparison from a Master degree to a Bachelor degree.First of all, a graduate degree is not for everyoneThe benefits you can gain from a graduate degree varies across industries and where you are in your career.For example, the marginal benefit you gain from a degree diminishes the more experience you have in the industry (e.g. a fresh graduate v.s. 10 years of work experience).Pursuing a graduate degree allows you to learn more about theory and allows you to specialize in a subfield in your industry. You will have more time to delve into fundamental concepts and understand niche insights compared to working directly after a bachelor’s degree or high school. This is because in a workplace, you are often pushed to complete tasks as soon as possible, leaving no time to develop a well-thought-out solution.There are also many project management skills that you can gain from a graduate degreeBecause a graduate degree is usually self-paced, I personally learned to look at the bigger picture, to prioritize goals with potential for huge impact, and work backwards from said goals.I have also learned to absorb information quickly and be question-oriented when reading through numerous articles.Overall, pursuing a graduate degree can train you to be autonomous, independent, and high-performing.A master’s degree gives you $380,000 more at retirementI used a financial planning application that I made to understand the economics of a graduate degree before pursuing it. The main benefit of this application is being able to visualize your finances with taxes automatically incorporated into the projections. This allows you to plan big-ticket decisions such as buying a house, a car, or… a graduate degree!Like any financial planning application, it is garbage-in-garbage-out: if you use unrealistic numbers, you will get unrealistic results.The parameters for comparisonUsing the application, I compare a bachelor’s degree salary with the costs and salary gain from a master’s degree. I used numbers researched from online sources:The industry is Computer Science (for salary information)A conservatively low bachelor’s degree salary of CAD 6000 / mo (Computer Science graduates that go to Silicon Valley / investment banking companies and the like earn much more)Master’s degree pay raise of 15% ([source] claims a 20% increase)The master’s degree takes 2 years (master’s degree salary starts after two years, and relevant funding lasts for 2 years, while the bachelor’s salary starts from year 0)Both pay rates increase at 3%, inflation rate average of 3%Using taxes in Canada, Ontario, Waterloo.Tuition and funding is based on Fall 2021 entry to University of Waterloo’s Master’s program (e.g. tuition of around CAD 50,100 for 2 years (6 terms), and approximately CAD 3,317 of funding per month)The projection in Figure 1 can be loaded via this link.To perform this comparison in the application, we set the bachelor’s degree salary to be negative.The breakeven for the master’s degree, assuming conservative estimates, is 13 yearsFigure 2. Projection showing the breakeven point for a Master degree compared to a Bachelor degree.What does this mean?That means in 13 years (as shown in Figure 2), you will have made the same amount of money as if you did not pursue the graduate degree. At the same time, your salary is higher at that point in time, meaning you will earn even more than your bachelor self moving forward.But how much more?At the end of retirement (assuming a retirement age of 65 and 40 years of working), you will have earned ~CAD 380,000 moreFigure 3. Projection of additional savings at the end of 40 years of working for a master’s degree compared to a bachelor’s degreeTaking into account interest rates / inflation at 3%, this is equivalent to getting CAD 116,480.87 now.This is because of the “time value of money” (e.g. a dollar 40 years from now is less valuable as a dollar now).What does this look like in other terms?This is equivalent to an additional 2x CAD 2,488 week-long vacations every year or an additional CAD 94.2 per weekThese numbers are of course subject to your actual increase in earnings (Hopefully above 15%!)BONUS: Without adjusting for taxes, your projections would be off by 77%!The projection without taxes can be seen in this link.With the same inputs, we can select the tax location to no taxes. With this setting, the projected savings at the end is CAD 672,707 which is 77% more than if you included taxes.ConclusionIn this article, I have compared the earnings increase of pursuing a master’s degree with the costs of the degree, and opportunity cost of sticking with a bachelor’s degree. The insights gained from this article can be extrapolated into the expected benefits of a doctoral degree.You can use finance.justinsj.com to automatically incorporate taxes and make your own projections.If you found this article useful or enjoyed it, I would really appreciate your clap :)If you have more ideas that you think can help, send me a message or comment down below!

Nov 4th, 2022

5 Performance metrics every system architect should know
system design conceptssystem design interviewsystem performanceit service managementsystem architecture
In this article, I describe a few (non-exhaustive) performance metrics every system architect should know.The goal of system architects is to design and oversee the development of IT infrastructure that supports business goalsFirstly, we need to understand what a system architect does:A system architect is in charge of devising, configuring, operating, and maintaining both computer and networking systems. They objectively analyze desired processes and outcomes and advise on the right combination of IT systems and components to achieve specific business, department, team, or functional goals (Shiff, 2022).With this, every system architect must fully understand the different IT services being supported, how they interact with each other, and the performance requirements of each one and as a whole.There are 5 important metrics useful for measuring service performanceFigure 1. A simple request, process, response sequence between two services.1. Latency (first-byte)The first important metric is the first-byte latency. This is the time it takes for the smallest input (typically a single byte) to be processed from the start of the request to the end of the response. These are often what are written in hardware or system specifications (e.g. disk latency, memory access latency, etc.).2. Latency (end-to-end)The end-to-end latency, similar to first-byte latency, is the time it takes from the start to finish of the transaction. The difference between the two arises due to processing times that depend on the size of the input. For example, matrix multiplication between two 1000x1000 matrices takes longer than two 2x2 matrices.This is the performance metric that system architects need to be aware of for every service. It is especially important when gathering numbers to be aware of this relationship between latency and input size. For example, comparing the end-to-end latency of processing a small input to a large input is like comparing apples to oranges.3. ThroughputThroughput is the number of tasks that a service completes within a given time range. For example, services are often measured in terms of requests per second (rps).4. BandwidthBandwidth is the maximum rated capacity of a service. A typical example of this is network bandwidth, which is what is advertised by the Internet Service Provider (ISP) based on the specifications of hardware used.In a service, the bandwidth is essentially the maximum number of requests it can process per second. In contrast, throughput is the actual requests per second that is realized by the system, which is equal to or less than the bandwidth.5. ConcurrencyFinally, concurrency is the number of requests that a service can process at the same time. Note that this is measured with a time duration as the denominator (e.g. 100 concurrent requests v.s. 1000 requests per second).The maximum concurrency of a system and the average latency of requests define the bandwidth of the system:100 concurrent requests * 500ms requests means = bandwidth of 200 requests per secondSystem architects need to identify the bottleneck in order to find opportunities for improvementTo increase the performance of a system, different strategies could be used. For example, decreasing the end-to-end latency of requests by minimizing the processing time can increase the bandwidth of the service. Similarly, horizontally scaling the service by adding more worker nodes can increase the concurrency and thus can also increase the bandwidth of the service.To identify such opportunities, system architects can think like chemistsAn analogy to Chemistry is that in a chemical reaction, with material inputs converted to outputs, the expected amount of output can be determined by finding the “limiting reagent”.In IT services, the bottleneck can be the memory space of a system. For example, a worker node may only be able to host 4 instances of a service due to the memory size of each service being a quarter of the worker node’s memory capacity.Since memory is the limiting reagent, the compute power of the worker node must be underutilized. To tackle this, decreasing the memory size of the instances, or even shuffling instances in the memory through paging could be techniques to increase the bandwidth of the service.ConclusionIn this article, I have described 5 important performance metrics that system architects should be aware of. These metrics are first-byte latency, end-to-end latency, throughput, bandwidth, and concurrency. To identify ways to improve a service and meet desired performance levels, the system architect must identify the bottleneck in the system. Knowing the bottleneck will point to solutions that will help, and rule out solutions that will not.If you enjoyed this article or learned something from it, I would really appreciate your clap :)If you have more ideas that you think can help, send me a message or comment down below!

Oct 28th, 2022

Why you need to build habits AND set goals
habits for successproductivitygoals in life
This article describes the benefits of building habits, and why you need to pair them with goals. The underlying force of why we want to build habits and set goals is to maintain high motivation to be productive in our lives.The benefits of building habitsThere are several life-changing keystone habits. These include regular exercise, bullet journaling, reading, and meditation according to Improvement Pill’s video on ranking 32 habits. Among other powerful habits are cooking, writing, socializing, etc.The reasons these habits are great is because they focus on your healthThat is, they generally revolve around physical, mental, and emotional health. This allows you to become more energized, recuperate, and develop better learning from your daily life.Another reason building habits is good is to exhibit continuous progressThis is another important point from Improvement Pill’s video where our many failures in life can lead to significant demotivation especially when we are aiming for a lofty goal. This is because success and failure are binary results — either we did it or not. Meanwhile, building the right habits contribute the chances of our next attempt being successful.For example, if our goal is to become an entrepreneur and start a successful business, an important habit to build is to talk to customers, and even if several of our businesses fail, it is crucial to recognize that we are actually closer to achiveing our goal.A view from a different lens — Failing multiple times is like running in circles, building habits is like rising in a spiralWhat feels like running in circles is an upward spiral if you build powerful habits.In my own experience in developing a thesis for my Masters program, I had to find a topic that was not yet well-researched. I numerous topics one after another, each time finding that this problem had already been addressed. This felt like running in circles as I was back to not having a topic every time.However, along the way, I developed strong habits that accelerated my research paper reading skills. Specifically, this is the habit of first developing target questions and then scanning papers first to find the answers instead of reading the whole paper in one go. Because of this, later iterations of this topic-search process were easier. Eventually, after looking through 6 different topics in the field of Serverless architecture and Networking, I settled on a 7th topic involving accelerating GPU cold starts in serverless data centers.The limitations of building habitsHowever, just building habits for the sake of building habits will still lead to demotivation. This is speaking from personal experience. In my case, reading papers on a regular basis is a good habit, but it felt like my newly developed skills have only gotten me so far. Remembering and reminding myself of the goal of completing the thesis program and getting better leverage in my industry helped empower me to move forward. It also helps to break such broad goals down into smaller phases to make it feel closer and more achievable.Without a dream, there is no real reason to build a habitIn this case, you will find yourself with no motivation even if you have build the habit without seeing progress made to some direction. A quick reminder of WHY you are building a habit is important.It is important to note that busy ≠ productive —just because you are fully occupied, does not mean you will acquire a sense of achievement. It is crucial then to set goals that matter to you.The benefits of setting goalsSetting goals can inspire you to work towards itOur goals, whether it is to become an influencer, become a data analyst, or to become an athlete, help motivate us to take action.The path towards it becomes clearer when we set our goalsBy starting with “what success looks like”, it then becomes easier to work backwards, and find out that in order to reach some milestone of say, getting 100k followers, we need to begin writing articles every week.Why this works so well is because by setting our goals, we fix a point in our future of where we want to be, then any action we plan on taking from now on can easily be deciphered as building towards it, or not.The limitations of setting goalsGoals give binary results, which can be disappointingAs mentioned before, because we either succeed or fail in meeting our goals, it can lead to demotivation when we fail. Goals have no means of showing progress, and thus are limited in that way.Goals can and tend to be too broadSome argue that you should make your goals as wild as possible (e.g. aim to make 10 million this year instead of just aiming for 100 thousand (Ferris, 2009) in the book “The 4-Hour Workweek”. Whether your goal is wild or not, analyzing this goal and working backwards to define next steps is crucial to gaining the motivation to work towards it.Reaching your goal can lead to demotivationUpon climbing to the top of a mountain, we can breathe in the fresh air and a great view, but from there, if there is no other mountain in sight, the path ahead is only downwards. When we meet our goals, especially after an immensely long journey, focusing on the lack of further goals, and not paying attention to the positive habits that we have built and is fuel for pessimism.Some claim that talking about your goals makes you less inclined to doing itDerek Sivers in a 2014 TED talk says this because when you talk about your goal, you picture yourself more in your completed state, allegedly causing you to be more complacent and not work towards it.Arguably for me, discussing my goals with my peers helps me refine them and energizes me to work towards it.ConclusionOverall, the path towards meaningful productivity rather than wasteful occupancy looks like setting a high-level goal for ourselves, working backwards to what our next steps should be, then building the habits to maximize our chances of reaching that goal.I hope these tips can help you become more productive and motivated. If so, I really appreciate your clap :)If you have more ideas that you think can help, send me a message or comment down below!

Oct 21st, 2022

Proactive or Reactive Provisioning, Which is Better in Serverless Systems?
resource managementcomputer scienceserverless architectureserverlessscheduling
This article describes the similarities and differences of scheduling policies in serverless. In partcilar, I will focus on the dimension of proactive v.s. reactive provisioning in the environment of serverless systems. I list out the different policies by goal and effect, then briefly describe each one.The paradigm of “serverless” consists of two main parties: the service provider, and the business customer.The business customer itself includes developers that upload code to the service provider. The business customer also has end-customers that request the usage of the uploaded code via an Application Programming Interface (API). These requests may be triggered from interacting with the business’ website, or other devices used by the business.The overall objective of Serverless is to provide businesses with an economic “pay-as-you-go” option for hosting code, with comparable performance to on-site servers.Serverless service providers are able to build a business through economies of scale and sharing its infrastructure with multiple tenants (business customers). For example, businesses who purchase a couple of server-grade machines are likely not going to use them 100% (maximum utilization), which means there is space for sharing this capacity, which is what serverless service providers do.On the business customer side, this enables businesses to use the compute infrastructure on-demand, thus only paying for what it uses, rather than paying the up-front capital cost of building / setting up servers and the necessary network infrastructure.Photo by Elena Mozhvilo on UnsplashThe main problem in serverless is “cold starts“— in order to share the infrastructure, the business customers’ code needs to be shuffled in and out, which leads to several requests occurring with no instance of the code already running.To tackle this problem serverless service providers rely on scheduling techniques to manage the trade-off between cold start penalties and server utilization.There are several examples of scheduling policies adopted by current commercial offerings of Serverless:AWS Lambda: Bin Packing — AWS Lambda appears to aim to have the fewest possible number of instances running to serve a load of requests. AWS Lambda uses the amount of memory required by the function as declared by the developer to determine if new VMs need to be instantiated to meet demand.Google Cloud Functions (GCF): Utilization-based— Google enables the most configurability in its developer-specified scaling policy. However, this is arguably contradictory to the paradigm of serverless where it should be the role of the service provider to scale instances in and out. GCF allows developers to use CPU utilization, HTTP serving rate, and cloud metrics as signals to scale in and out. GCF also allows developers to set the minimum number of instances to reduce the cold start frequency for a function.Microsoft Azure Functions: Queue-Length Based—Azure Functions scale differently depending on the trigger. For example, using an Azure Queue storage trigger, scales the number of instances using the queue length and age of the oldest queue message.Other scheduling techniques include:Heuristics — Least Connections, Round Robin. These scheduling policies are often mentioned in load balancing. As a note, these do not determine the amount of server resources allocated to a certain piece of code and thus are not provisioning policies.More Bin-Packing Scheduling — On the contrary, some scheduling policies like bin-packing can influence the system’s provisioning strategy. For example, the popular open-source OpenWhisk serverless platform relies on keep-alive timeouts to reduce the number of instances when an instance is not used. It uses a hashing scheduler that attempts to schedule requests primarily on the “first” available worker based on an order defined by a hashing function, allowing older instances to become stale and deallocated.More Utilization-based Scaling— One of the challenges with bin-packing scheduling is runtime performance degradation due to sharing VM resources among multiple containers as discussed in TK1. To address this, TK2 aims to balance runtime performance with resource efficiency by setting a target range of CPU / memory utilization, and scaling instances in-out based on that.Prediction-based — Ideally, if the number of incoming requests can be predicted, instances can be pre-provisioned as the rate or requests increase. Several works including (Zhang et al, 2013) and (Zhang et al, 2019) use Auto-Regressive Integrated Moving Average (ARIMA) and LSTM ML models respectively to predict the future request rate and scale in/out correspondingly. In addition, functions in a pipeline (function chain) can be more easily predicted (Daw et al, 2020), (Banaei and Sharifi, 2021). The main limitation of these methods depend on the predictability and amount of historical information of the workload. These works also incur large computational overhead due to the usage of ML models to perform the inference for scheduling actions that occur at 1000s of requests per second.Logistics-based — Another class of scheduling techniques are based on the study of logistics and queuing theory. For example, (Suresh et al, 2020) uses the square-root staffing policy to pre-provision extra resources based on the volatility of demand and a target service rate (cold start frequency).A provisioning strategy determines when instances of code are “warmed up”.Now, let’s divide these methods by proactive and reactive provisioning strategies.Proactive ProvisioningThese methods typically aim to increase performance (by reducing cold start frequency) while sacrificing server utilization. This is done by proactively running instances of code, which could remain unused but is prepared to receive new requests.Serverless service providers that use this policy tend to continue charging by the actual number and duration of requests, thus absorbing the idle resource cost instead of passing the cost of running idle servers to the business customers.Proactive provisioning policies include:Prediction-based policiesUtilization-based policiesLogistics-based policiesReactive ProvisioningThese methods aim instead to minimize resource costs by lazily instantiating new instances of request code when the current allocation of servers do not meet an increasing load of oncoming requests.By doing this, serverless service providers do not incur additional idle server costs, but sacrifices performance by having an increased frequency of cold starts. This may be unattractive for business customers that have stringent latency requirements.Reactive provisioning policies include:Bin-packing policiesHow can these problems be solved?There are different research directions to tackle this trade-off between resource efficiency and performance, which include:Reducing the cost cold start. By reducing the cost of cold starts, reactive provisioning can become more attractive. This is because idle resources can be instead used for actual computation rather than awaiting future requests that may not arrive. Reactive provisioning with low cold start costs are especially attractive with increasing adoption of accelerators such as GPUs in serverless due to the expensive nature of GPUs.Accurately predicting future workload. As noted previously, accurate prediction of workloads can ideally allow maximum resource utilization while minimizing cold start penalty. Workload prediction works in both individual functions as well as function chains.Reducing the cost of idle resources. Under the paradigm of proactive provisioning to minimize cold start frequencies, an alternative is to reduce the cost of idle resources. This can be done by using cheaper / lower-end machines to host proactively provisioned instances.ConclusionThis article compares and contrasts proactive and reactive provisioning strategies. There are more diverse proactive provisioning policies than reactive. This article starts by identifying the motives of actors in the serverless paradigm, mainly service providers and business customers, then by identifying commercial scheduling policies and relating them back to provisioning policies. Finally, future directions for research in serverless are provided.If you enjoyed this article and want more, I would really appreciate your clap :)If you have more ideas that you think can help, send me a message or comment down below!

Oct 14th, 2022

Acute Procrastination Syndrome — and How to Cure It with 3 Tips
procrastinationproductivity tips
Acute Procrastination Syndrome — and How to Cure It with 3 TipsI’m often known for being interested in a topic or hobby for a short period of time and leaving several projects unfinished. If you face this too, then you are not alone. In this article, I will describe 3 key tips to avoiding this level of procrastination.When it comes to craft hobbies, I always purchase necessary equipment, finish one sample, then tend to move on to another hobby.When it comes to entrepreneurship, I believe I put enough effort to discover that these ideas are not worth pursuing.This type of issue can be seen in many different levels, and is what I would call “Acute Procrastination Syndrome”.Recently, I have noticed this in the number of drafts that have accumulated in my Medium account in Figure 1. This shows that I frequently delve into a topic, write a few key points about it, but usually do not complete an article about it.Figure 1. An accumulation of drafts.To understand this problem, we need to break it down into the forces involved.On one end, we want to finish a project. However, the project often appears too daunting for us to tackle, thus we leave it to a later time when we feel more ready to face it. This then repeats and the cycle of procrastination goes on indefinitely. This issue is also compounded by the number of different interests we have, which give more reason to leave other projects for another.These are the key forces that lead to procrastination:The scope of a project is too bigYou have many things to work on, but do not know what to prioritizeThere is no urgent deadline for the projectIn order to tackle these, the following tips are essential:Break down (quantize) the project into phases, and limit the scope. Once the phases of a project are identified, you can break it down further into standalone, relevant, bite-sized tasks. This will help you get over the initial procrastination barrier and consistently get you into a flow state. It will also help you continuously make progress, which encourages you further to complete the project. Taking the example of writing articles on Medium, I narrowed down the scope of the broad topics I had in mind by avoiding topics that I have no significant experience in.Learn how to prioritize among tasks using The Ranking Table Method I published earlier. I highly recommend reading through it and practicing this method a few times. It will help you identify what criteria is important to you and effectively prevent you from procrastinating critical tasks. Once you are familiar with this method, you can develop intuition for prioritization, which improves your productivity tenfold.Set your own deadlines for small tasks. By picking a small task, you can estimate how much time it takes more confidently than a big undefined project. For example, a small task may be to write a paragraph for a topic, which we can estimate to be doable in 15 minutes. By using this thought process, we can then schedule this task on our calendar as a 15-minute event and almost guarantee that we will make progress towards this project.ConclusionBy identifying the forces that lead to procrastination, I have identified 3 important tips (quantization, prioritization, and setting deadlines) to tackle this problem. In this article, I have thoroughly described these tips and listed examples that show how these tips work in my own experience.I hope these tips can help you eliminate procrastination. If so, please clap :)If you have more ideas that you think can help, send me a message or comment down below!

Oct 7th, 2022

The One Prioritization Method That Will Boost Your Productivity and Focus
methodologyprioritizationproductivity hacksfocus
Oftentimes at work or in schooling, there are many tasks to complete. However, not all tasks are created equal. An important skill in life is to be able to prioritize. This article will teach you a simple way to prioritize tasks that only takes a few minutes and can be generalized to any set of tasks.Credit to Joel Muniz on UnsplashThe method works by creating a ranking table. I find that this works best for me using pen & paper, but you can also opt for using a spreadsheet, presentation software with tables, or a digital notepad.This method is intended as a rational way to approach prioritization. In the end, it is best to develop an intuition for what should be prioritized, and using this method regularly can help you get there.How does this benefit you?Before we get to the methodology, I want to explain why it is important, and how it can benefit you.This methodology will teach you 3 things:Lesson 1. Learn to break down projects into sizeable tasksLesson 2. Learn to identify importanceLesson 3. Learn to be selective and get into flow stateHow to Use a Ranking TableThere are 5 simple steps:1. List all your tasks in separate rowsAs an example, we can take selecting a book to read during free time. Each task is then reading a separate book.Different books have different genres, for me personally, I am interested in books on architecture, programming, as well as entrepreneurship.The table would look like as follows in Figure 1.:Figure 1. Initial ranking table with rows2. List out criteria as new columns in the tableNow, we want to identify criteria to indicate what is important to us. These are written out in the form of columns in the table.In the example, these could be:Financial application in the near term,Room for personal growth, andThe length of the book (the shorter the better)Other criteria, depending on your ultimate goal, could be:Discussability (level of controversy for social inquiry)Level of escapism (with the aim for relaxation)Etc.Tips for listing out these criteria include asking yourself:“What is your ultimate goal right now?” It could be to become more social, more financially stable, or something else.What abstract features of the task are aligned with your goal (e.g. provide the most value)?What concrete features are aligned with your goal?The table would then look like that in Figure 2. below:Figure 2. Ranking table with columnal criteria3. Score each task for each columnYou have to evaluate each task in the view of each criteria and give it a score of importance.You can do this by adding a ‘✓’ tick for each point that you give.In this step, aim to be as objective and fair as possible. It helps to look at each criteria one by one, marking each task before moving on to the next criteria.For me, this would look as follows in Figure 3.:Figure 3. Ranking table with score for each column4. Select your top 3 to work on todayFrom there, you can tally up the score for each task, and select which your top 3 tasks are for the day.In the example, I would only be reading one book and prefer not to switch multiple times in a day. The final ranking table would look as in Figure 4.:Figure 4. Tallied ranking table with final ranks.5. Select your top 1 to work on right nowFrom these three tasks, you can then select 1 to work on right now. Most likely, that will be the topmost ranked item.Once you have selected what you want to work on today, and you have convinced yourself that this is the best task to work on, then the rest of the world fades away and you can get into the flow. I know for me, it has!Do it enough and develop your intuitionWhat I love about this method is that you do not have to rely on it forever. When you do this enough, you start to develop an intuition for what is important and should be worked on right now.As such, this is a method that brings you to the next level and does not aim to inhibit your productivity.ConclusionThe ranking table can help you isolate the most important task for you at any given point in time. By practicing this method, you can perform your ranking quickly and become confident and focused in your work. This amplifies your productivity and satisfaction in your work.The ranking table method can help you identify what you care about in your life, as well as help identify when you are stuck with too many options.I hope this method can help you prioritize and focus on creating value from your actions. If so, please clap :)Happy Ranking!

Oct 1st, 2022

VideosI also make videos
Leadership AwardsAchievements that showcase my leadership & teamwork
Most Valuable Player in Executive Recruiting Consulting Corporate Project

For the team member voted as the most valuable player in the project.

REDbird Leadership Program Gold Award

For demonstrating outstanding leadership in the REDbird program.

REDbird Leadership Program Top Achiever

For demonstrating outstanding performance in coaching and leadership.

Best Poster Design & Presentation Award

For the group with the best poster design and presentation in a Hydrosystems Engineering course.

HKUST IDEERS Champion

For the team that builds the best structure withstanding a series of earthquake testing.

Academic AwardsAchievements that showcase my tenacity
Academic Achievement Medal

Top 1% of graduates with a final CGA of at least 3.9.

HKSAR Government Scholarship

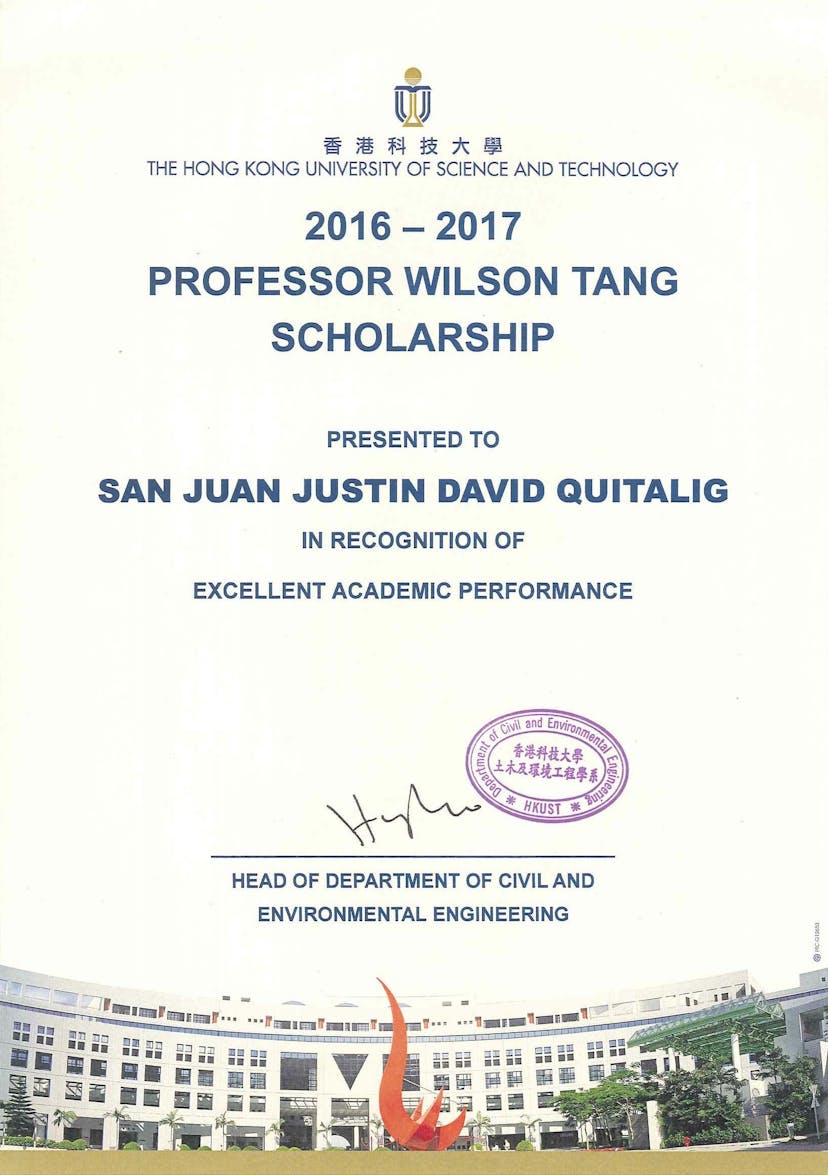
For students that demonstrate: (a) excellent performance in academic studies; (b) recognized contribution to the institution/society; (c) demonstrated leadership and good communication skills; and (d) strong commitment to the Hong Kong community

Professor Wilson Tang Scholarship & Award

For awarding outstanding first-year Engineering students choosing Civil & Environmental Engineering as their major program.

Governor General's Academic Medal

For the highest average upon graduating from a secondary school.

Academic and Athletic Excellence Awards

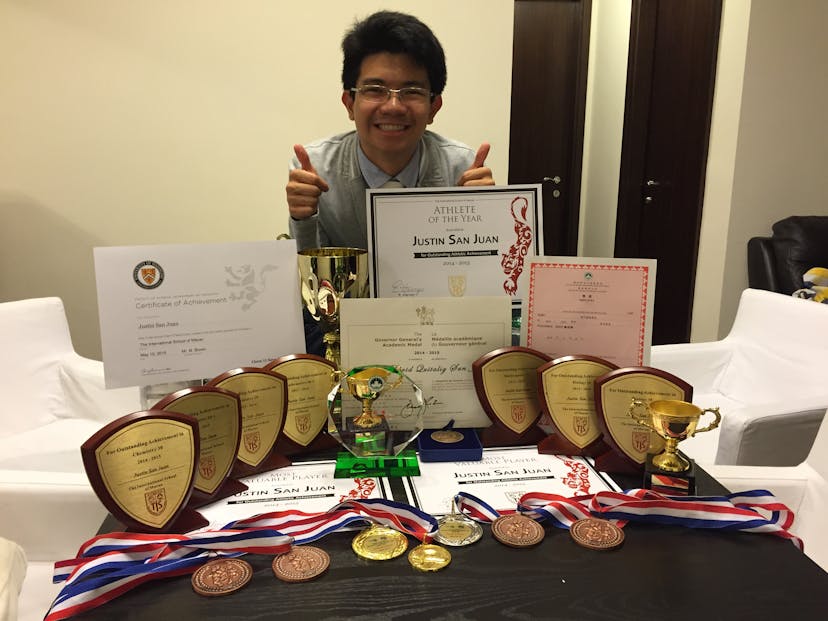
Numerous awards from high school.

Prémio Flor de Lótus

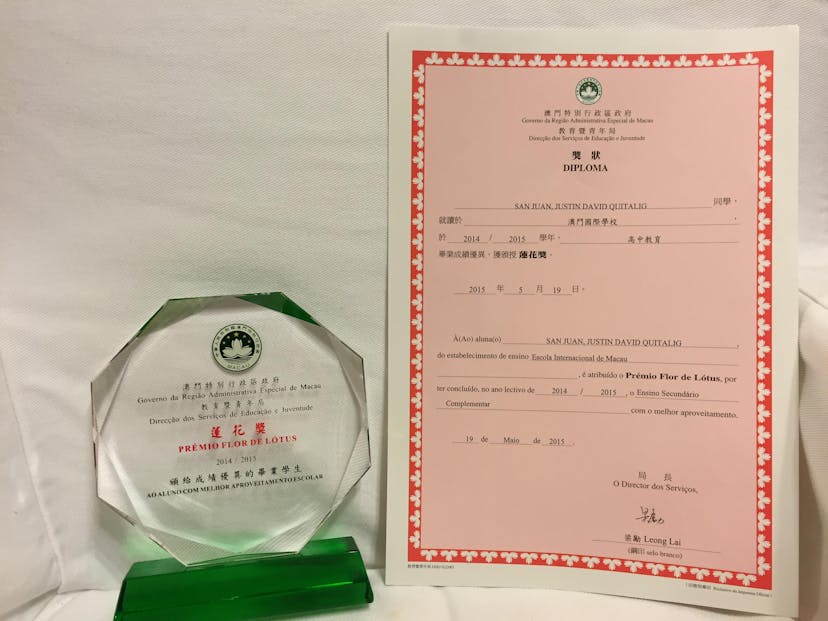
The highest average upon graduating from a secondary school.

Scholars
Scholars

For attaining the highest level of academic achievement of higher than 95%.

Athletic AwardsAchievements in the field of athleticism
Athlete of the Year
Athlete of the Year

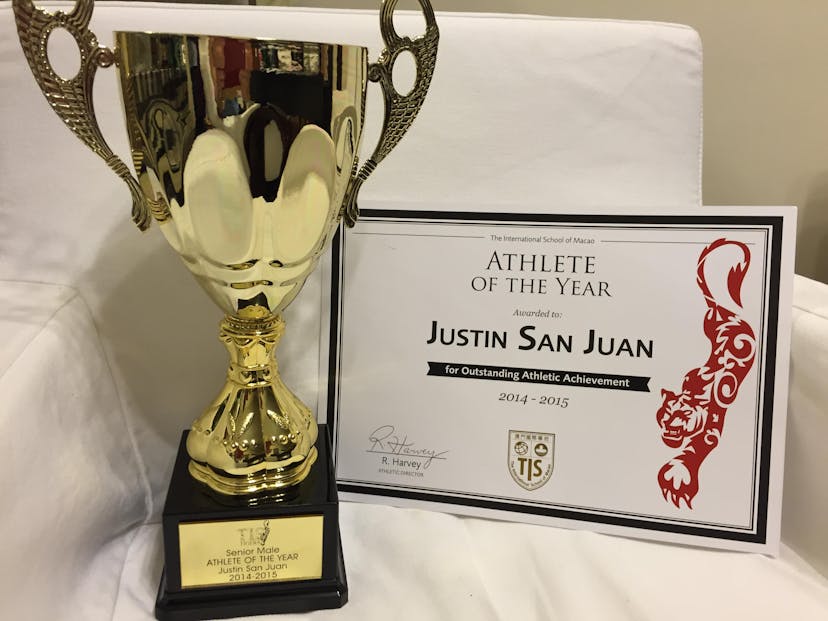
For one high school graduate for outstanding athletic achievement.

Action Asia Events Repulse Bay (12km) Champion

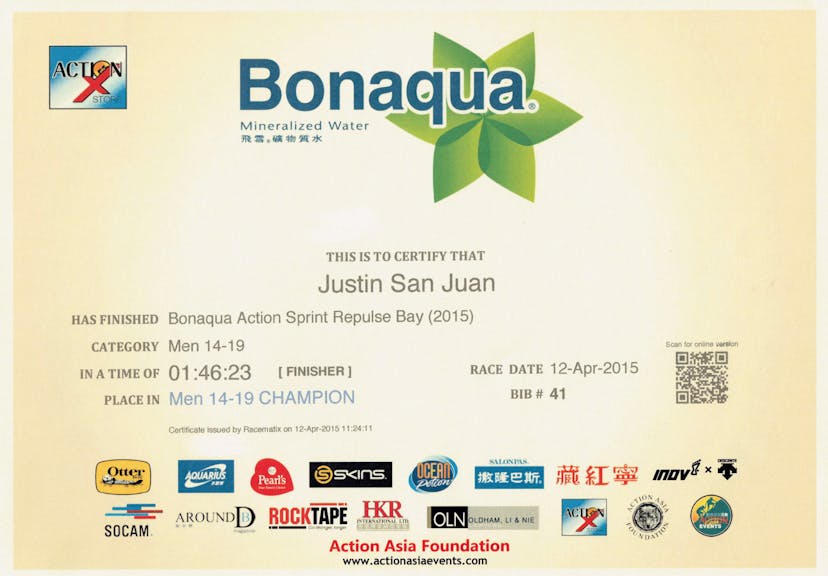
First place in the long-distance trail run in Repulse Bay.

ExtracurricularsI also enjoy giving back to the community
REDbird Leadership Program

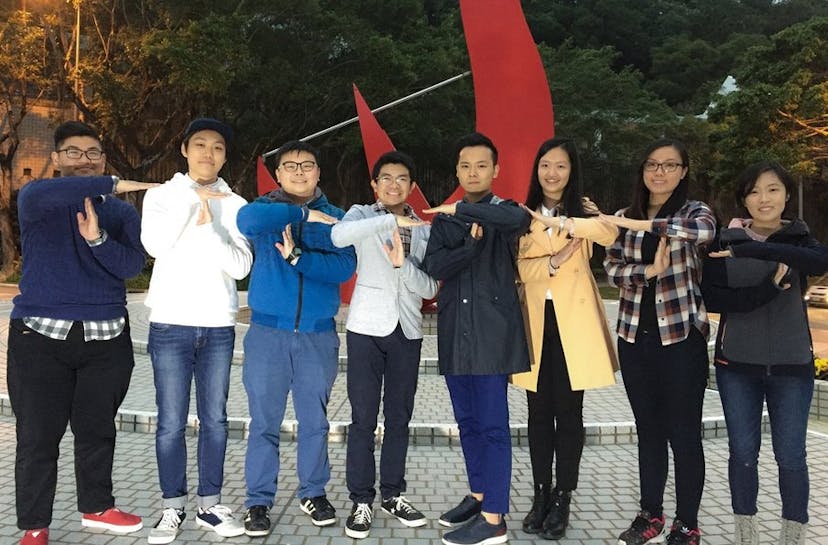
Gold Awardee & Top Achiever. Chaired team of 8 to host 5 unique workshops to empower individuals. I also coached our junior cohort and guided them through their own discovery and leadership journey.

Cambodia Service-Learning Trip

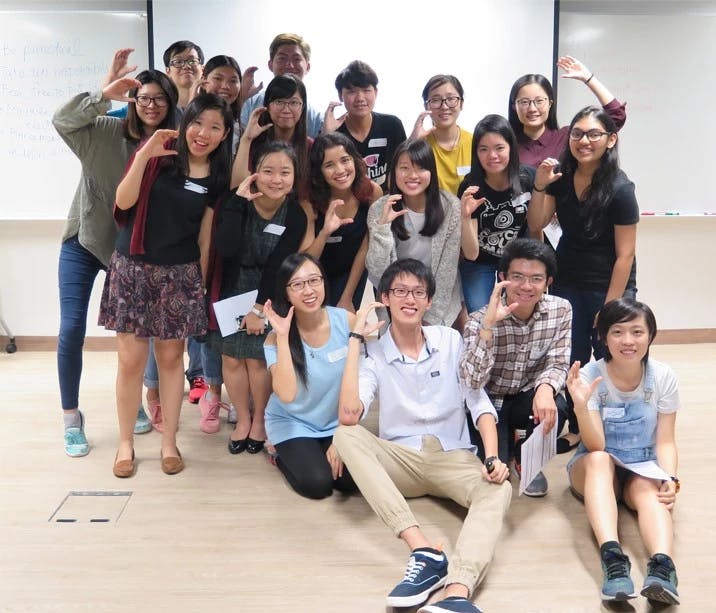
Organizing Committee Member. Orchestrated team of 18 to teach and support children in 3 different NGOs.

Teachings
Teachings

I love teaching and take the initiative to take instructional assistant roles in courses. Winter 2023 - [IA] CS116: Introduction to Computer Science 2 Fall 2022 - [IA] CS116: Introduction to Computer Science 2 Spring 2022 - [TA] CS251: Computer Organization and Design Winter 2022 - [IA] CS116: Introduction to Computer Science 2 Winter 2022 - [TA] CS116: Introduction to Computer Science 2 Fall 2021 - [TA] CS116: Introduction to Computer Science 2